Situation maps of Vistula Lagoon and Vistula Mouth
Situation maps for two areas: Vistula Lagoon and Vistula Mouth were prepared. The first map presents Sentinel-2 satellite images for the Vistula Lagoon on March 17th and 19th, 2018, where the changing state of the ice cover on a water body can be observed. As a result of the temperature increase cracks and displacement of the ice cover, as well as its melting, are visible.
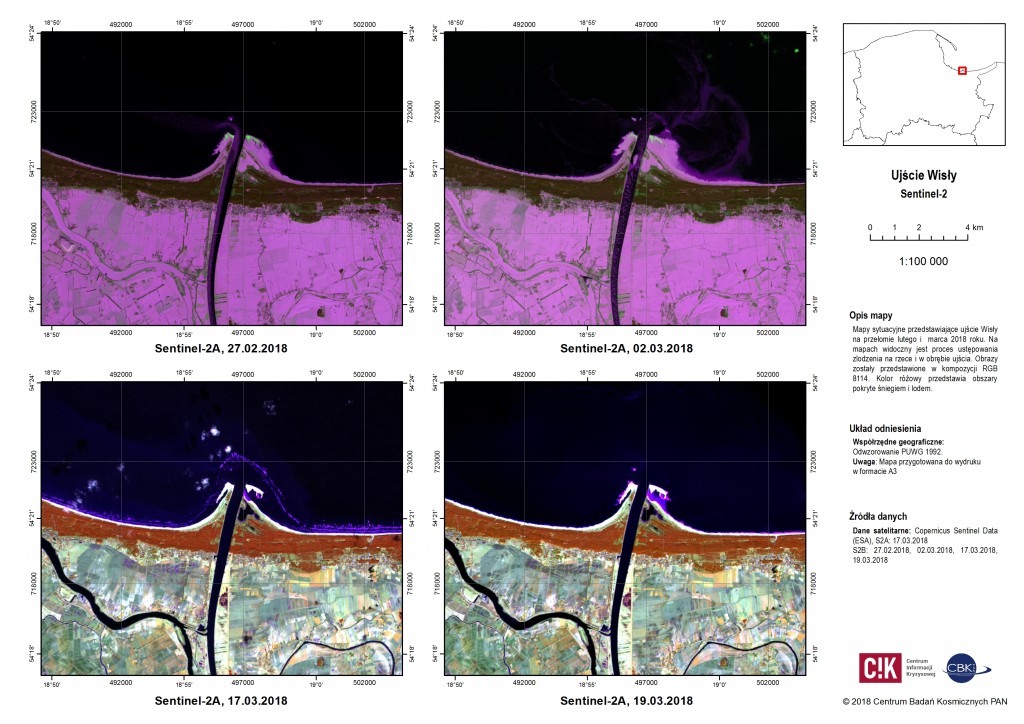
The second map presents the situation within the Vistula Mouth on February, 27th and March 2nd, 17th and 19th, 2018. The satellite images show changes in the riverbed itself, its mouth and along the coast. In all of these places the ice gradually disappears. In the vicinity of the “Mewia Łacha” reserve you can observe the direction of surface currents, which is visible in the shape of the ice cover in the area of the Vistula estuary to the sea (example: 27.02 and 2.03). The situation of March, 2nd corresponds with the forecast of sea surface currents.