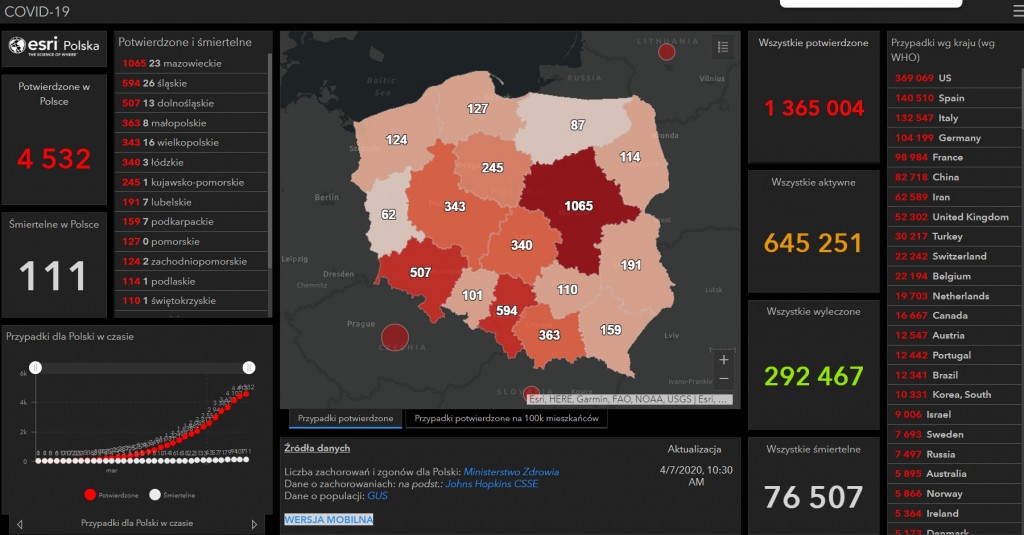
The overview of the COVID-19 maps for Poland
The first case of SARS-CoV-2 virus contamination was identified in Wuhan, Hubei province, China in December 2019. The virus that causes COVID-19 disease has spread throughout the world and as a result the World Health Organisation has declared a global pandemic.
In Poland, the first case of COVID-19 was detected on 4 March 2020 in Zielona Góra. At the end of the month there have been over 1000 confirmed cases, including 14 deaths. Unfortunately, the statistics are concerning – at the beginning of April there have been over 4500 COVID-19 confirmed cases and more than 100 deaths.
Since the beginning of March, many interactive maps and map applications have been created for the purposes of monitoring the current outbreak of coronavirus disease.
 COVID-19 cases map – The Ministry of Health
The Ministry of Health’s website is the official source of data on the COVID-19 epidemic in Poland. The governmental website shows current information and recommendations related to the epidemic. The data is presented in two forms:
- map of COVID-19 confirmed cases with regional division,
- table of COVID-19 confirmed cases.
A national version of worldwide popular map application of the John Hopkins University was developed by Esri Polska. The main live-updating map shows the number of cumulative confirmed cases, active cases, incidence rate and morality ratio in each voivodeship. Similar data is stored in a form of tables on the left side whereas on the right side tables containing the most important data for the whole world are presented. At the bottom of the dashboard you can verify the status of the data update. Esri’s application is based on data from the Ministry of Health, Statistics Poland and Johns Hopkins CSSE.
 Monitoring of coronavirus threat in Poland – GIS Expert
GIS-Expert company was one of the first to publish a web map presenting data on the spread of the COVID-19 epidemic in Poland. Interactive map presents data for individual provinces regarding: number of confirmed and active cases (total and per 100 000 inhabitants), deaths, number of people hospitalized, under epidemiological supervision, quarantined and cured.
 COVID-19 actions realized by State Fire Service and Volunteer Fire Service
Map application based on the Esri template shows the actions of the State Fire Service and the Volunteer Fire Service related to the COVID-19 epidemic in Poland. Application consists of four interactive maps and three bar graphs which present e.g.: number and locations of field admission rooms, border crossings or the amount of forces and resources involved in fighting the epidemic. At the bottom of the dashboard you can verify the status of the data update.
This interesting web map presents current number of confirmed cases, deaths and cured people by province. There is also presented information such as the number of people hospitalized, under epidemiological supervision, quarantined and COVID-19 tests conducted. In Statistics window you can analyse basic statistics in form of histograms.
A layer Infectious disease hospitals was added on the Inspire Hub platform. It presents location of infectious diseases hospitals receiving patients with COVID-19 in Poland.
National geoportal has added to its resources new folder with data: Coronavirus. It contains 3 layers: confirmed cases (number of confirmed cases and deaths by province), the State Sanitary Inspection (location of sanitary and epidemiological stations) and infectious diseases hospitals (location and basic information).
This simple web map presents the most important data with regard to the COVID-19 epidemic in Poland, e.g.: number of confirmed cases, people hospitalized, quarantined, cured and COVID-19 tests conducted. The web map consists of 5 layers with location of: hospitals for infectious diseases, deaths, laboratories, sanitary and epidemiological stations, border crossings. Every icon has got a pop-up window with additional information. Map application also presents statistical analysis and simulation of COVID-19 spread in Poland in the first 3 weeks since epidemic outbreak on 4 March 2020.
This website has maps, numerous charts and tables with statistics concerning COVID-19 epidemic in Poland and worldwide. The main sources of data are the Ministry of Health for Polish statistics and Worldmeter.info for information from the world. The tweets of the Ministry of Health and the Main Sanitary Inspectorate have been embedded next to the map, which allows you to read the messages about the current epidemic situation in Poland published by both institutions.
The main aim of the project “Virus on the map” carried out by the GeoSiN Science Club from the University of Warmia and Mazury in Olsztyn is the monitoring of COVID-19 epidemic spread in Poland. By gathering information not only from government announcements, but also from nationwide and local media, the epidemic data presented is more accurate, going down to the poviat level. The map with a slider allows you to select a date or time period and makes it possible to analyze the dynamics of epidemic development from its beginning on 4 March until today. Another interesting map shows infectious hospitals located closest to a given locality along with the distance to them given in km. The authors stipulated that due to the increase in the number of COVID-19 cases and difficulties in maintaining the database at the assumed level of detail and timeliness, updates may cover only a couple of regions in the future.


